Bartlett's Test Calculator
Bartlett's test is used to test the assumption that variances are equal (homogeneous) across groups. For help in using this calculator, read the Frequently-Asked Questions or review the Sample Problem.
To learn more about Bartlett's test, read Stat Trek's tutorial on Bartlett's test.
Frequently-Asked Questions
Instructions: To find the answer to a frequently-asked question, simply click on the question.
What is Bartlett's test?
Bartlett's test is used to test the assumption that variances are equal (i.e., homogeneous) across groups. The test is easy to implement and produces valid results, assuming data points within groups are randomly sampled from a normal distribution.
Because Bartlett's test is sensitive to departures from normality, a normality test is prudent. Several ways to check for departures from normality are described at: How to Test for Normality: Three Simple Tests.
Note: Unlike Hartley's Fmax test, which also tests for homogeneity, Bartlett's test does not assume equal sample sizes across groups.
How does Bartlett's test work?
Bartlett's test is an actual hypothesis test, where we examine observed data to choose between two statistical hypotheses:
- Null hypothesis: Variance is equal across all groups.
H0: σ2i = σ2j for all groups
- Alternative hypothesis: Variance is not equal across all groups.
H0: σ2i ≠ σ2j for at least one pair of groups
Like many other techniques for testing hypotheses, Bartlett's test for homogeneity involves computing a test-statistic and finding the P-value for the test statistic, given degrees of freedom and significance level. If the P-value is bigger than the significance level, we accept the null hypothesis; if it is smaller, we reject the null hypothesis.
What steps (computations) are required to execute Bartlett's test?
The steps required to conduct Bartlett's test for homogeneity are detailed below:
- Step 1. Specify the significance level ( α ).
- Step 2. Compute the sample variance ( s2j ) for each group.
s2j = [ Σ ( X i, j - X j ) 2 ] / ( n j - 1 )
where X i, j is the score for observation i in Group j , X j is the mean of Group j, n j is the number of observations in Group j , and k is the number of groups.
- Step 3. Compute the pooled estimate of sample variance ( s2p ).
N = Σ n i
s2p = [ Σ ( n j-1 ) s2j ] / ( N - K )
where n j is the sample size in Group j , k is the number of groups, N is the total sample size, and s2j is the sample variance in Group j.
- Step 4. Compute the test statistic (T).
A = ( N - k ) * ln( s2p )
B = Σ [ ( n j - 1 ) * ln( s2j ) ]
C = 1 / [ 3 * ( k - 1 ) ]
D = Σ [ 1 / ( n j - 1 ) - 1 / ( N - k ) ]
T = ( A - B ) / [ 1 + ( C * D ) ]
where A is the first term in the numerator of the test statistic, B is the second term in the numerator, C is the first term in the denominator , D is the second term in the denominator, and ln is the natural logarithm.
- Step 5. Find the degrees of freedom ( df ), based on the number of groups ( k ).
df = k - 1
- Step 7. Find the P-value for the test statistic. The P-value is the probability
of seeing a test statistic more extreme (bigger) than the observed T statistic from Step 4.
It turns out that the test statistic (T) is distributed much like a chi-square statistic with ( k-1 ) degrees of freedom. Knowing the value of T and the degrees of freedom associated with T, we can use Stat Trek's Chi-Square Calculator to find the P-value - the probability of seeing a test statistic more extreme than T.
- Step 7. Accept or reject the null hypothesis, based on P-value and significance level. If the P-value is bigger than the significance level, we accept the null hypothesis that variances are equal across groups. Otherwise, we reject the null hypothesis.
What should I enter in the field for number of groups?
Bartlett's is designed to test the hypothesis of homogeneity among nonoverlapping sets of data. The number of groups is the number of datasets under consideration.
What should I enter for significance level?
The significance level is the probability of rejecting the null hypothesis when it is true. Researchers often choose 0.05 or 0.01 for a significance level.
What should I enter for sample size?
Sample size refers to the number of observations in a group. For each group, enter the number of observations in the space provided.
Note: Unlike some other tests for homogeneity (e.g., Hartley's Fmax test), Bartlett's test does not require equal sample sizes across groups.
What should I enter for variance?
In the fields provided, enter an estimate of sample variance for each group. To compute sample variance ( s2j ) for each group, use the following formula:
s2j = [ Σ ( X i, j - X j ) 2 ] / ( n j - 1 )
where X i, j is the score for observation i in Group j , X j is the mean of Group j, and n j is the number of observations in Group j .
What is degrees of freedom?
Bartlett's test computes a test statistic (T) to test for normality. The degrees of freedom ( df ) for a chi-square test of that statistic is:
df = N - k
where N is the total sample size across all groups, and k is the number of groups in the sample.
What is the test statistic (T)?
The test statistic (T) is the statistic used by Bartlett's test to make a decision about whether to accept or reject the null hypothesis of equal variances between groups. When T is very big, we reject the null hypothesis; when T is small, we accept the null hypothesis.
The calculator computes a T statistic, based on user inputs. The formulas that the calculator uses to compute a T statistic are given at Bartlett's Test for Homogeneity of Variance.
What is the P-value?
If you assume that the null hypothesis of equal variance is true, the P-value is the probability of seeing a test statistic (T) that is more extreme (bigger) than the actual test statistic computed from sample data.
How does the calculator test hypotheses?
Like many other techniques for testing hypotheses, Bartlett's test for homogeneity of variance involves computing a test-statistic and finding the P-value for the test statistic, given degrees of freedom and significance level.
If the P-value is bigger than the significance level, the calculator accepts the null hypothesis. Otherwise, it rejects the null hypothesis.
Sample Problems
Problem 1
The table below shows sample data and variance for five groups. How would you test the assumption that variances are equal across groups?
| Group 1 | Group 2 | Group 3 | Group 4 | Group 5 |
|---|---|---|---|---|
| Sample Data | ||||
| 1 2 3 4 5 |
1 3 5 7 9 |
1 4 7 10 13 |
1 5 9 13 17 |
1 6 11 16 21 |
| Variance | ||||
| 2.5 | 10 | 22.5 | 40 | 62.5 |
One option would be to use Stat Trek's Bartlett's Test Calculator. Simply, take the following steps:
- Enter the number of groups (5).
- Enter the significance level. For this problem, we'll use 0.05.
- For each group, enter sample size. In this example, the sample size is 5 for each group.
- For each group, enter a sample estimate of group variance.
Then, click the Calculate button to produce the output shown below:
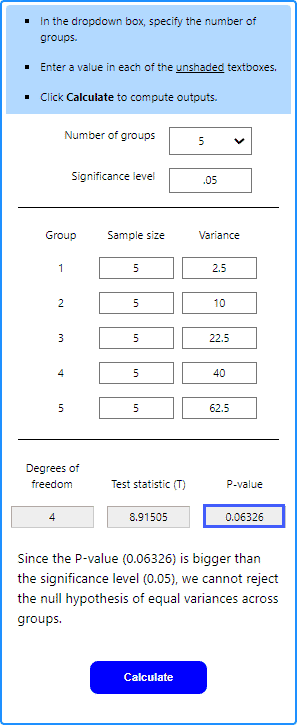

From the calculator, we see that the test statistic (T) is 8.91505. Assuming equal variances in groups and given a significance level of 0.05, the probability of observing a test statistic (T) bigger than 8.91505 is given by the P-value. Since the P-value (0.06326) is bigger than the significance level (0.05), we cannot reject the null hypothesis of equal variances across groups.
Note: To see the hand calculations required to solve this problem, go to Bartlett's Test for Homogeneity of Variance: Example 1.